HOW IS POWER BI USEFUL?
Extract data insights with no coding skills required
One of the main strengths of Power BI is its intuitive user interface that allows both technical and non-technical analysts to build data visualizations and analyses efficiently.
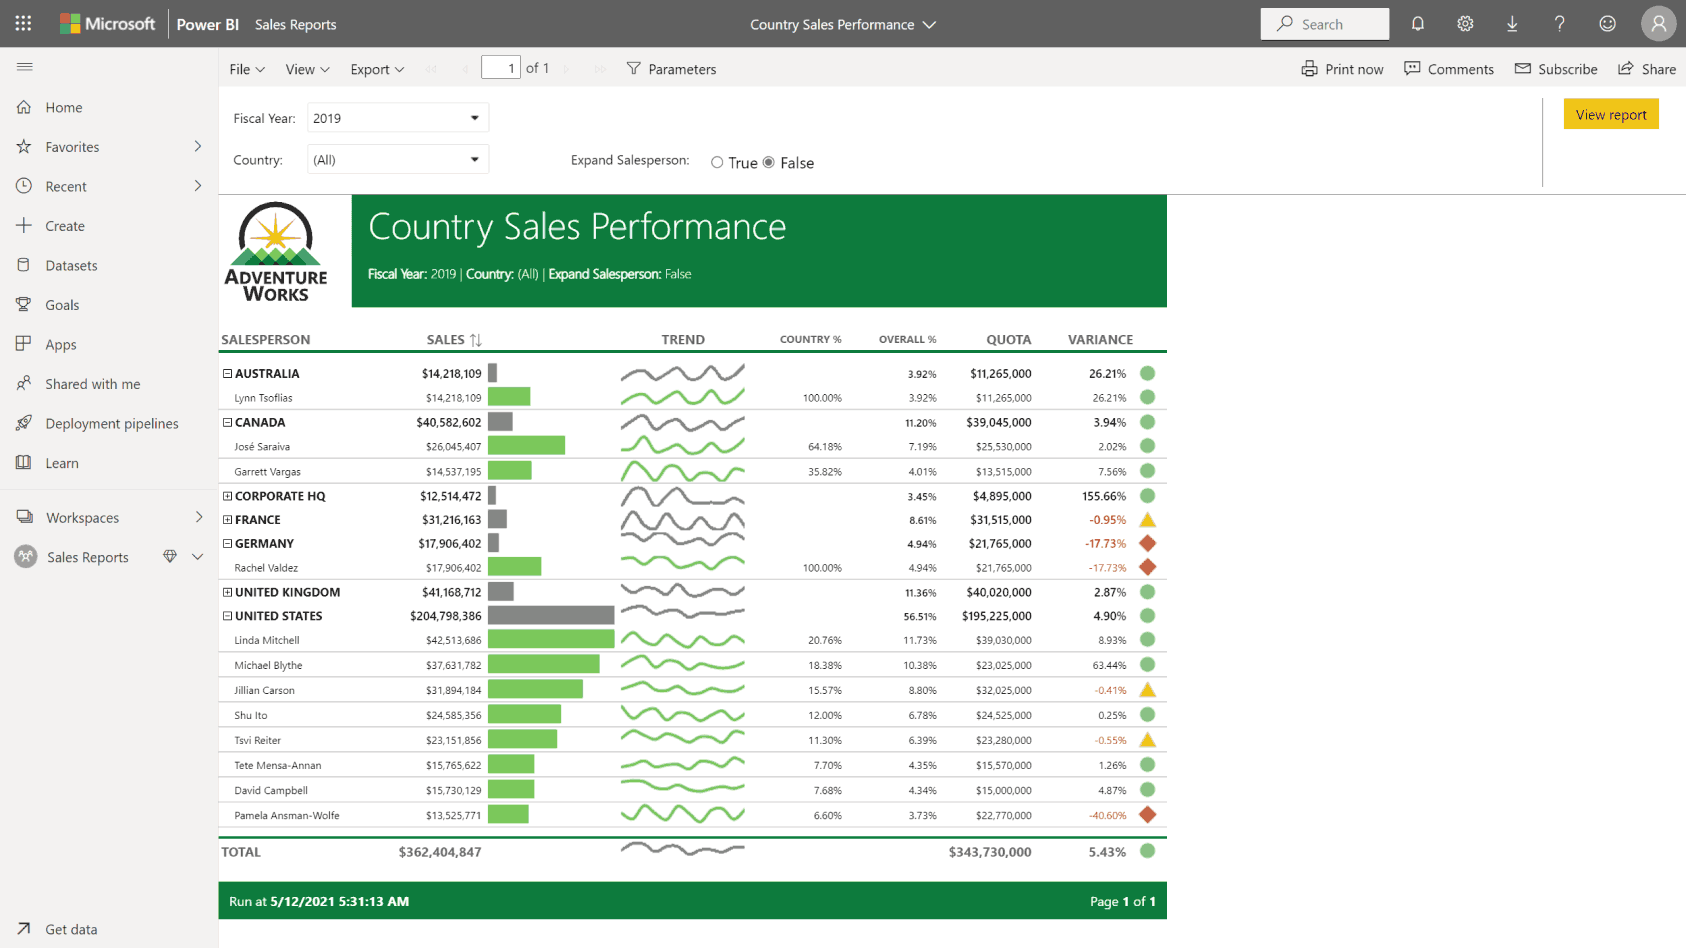
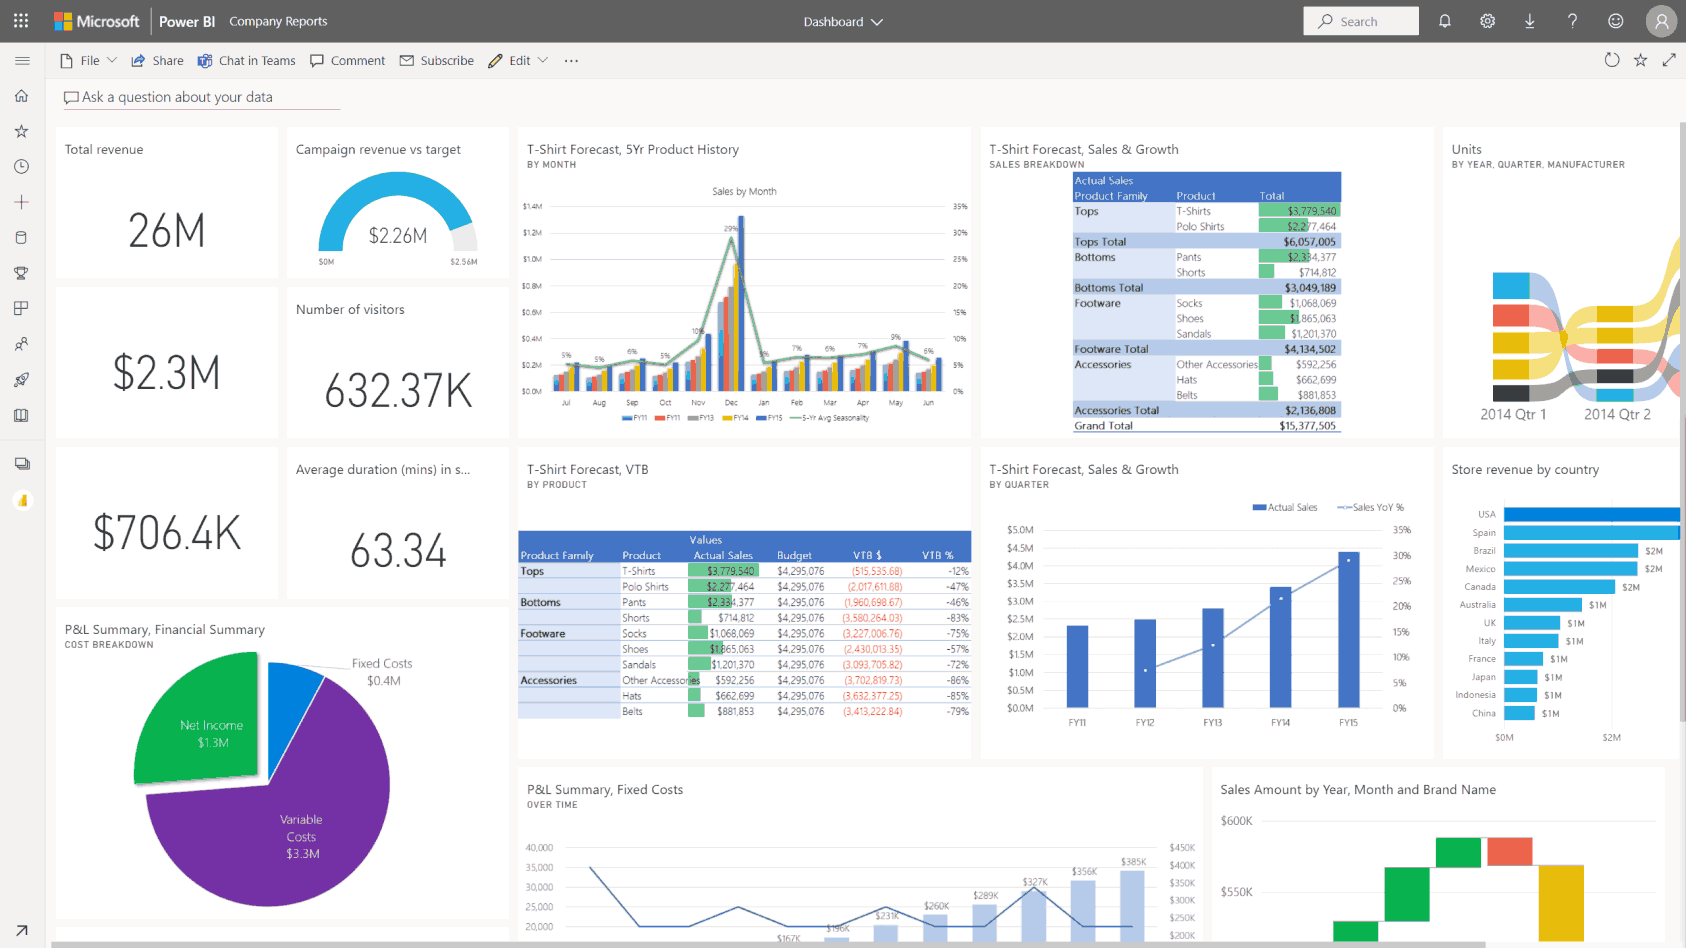
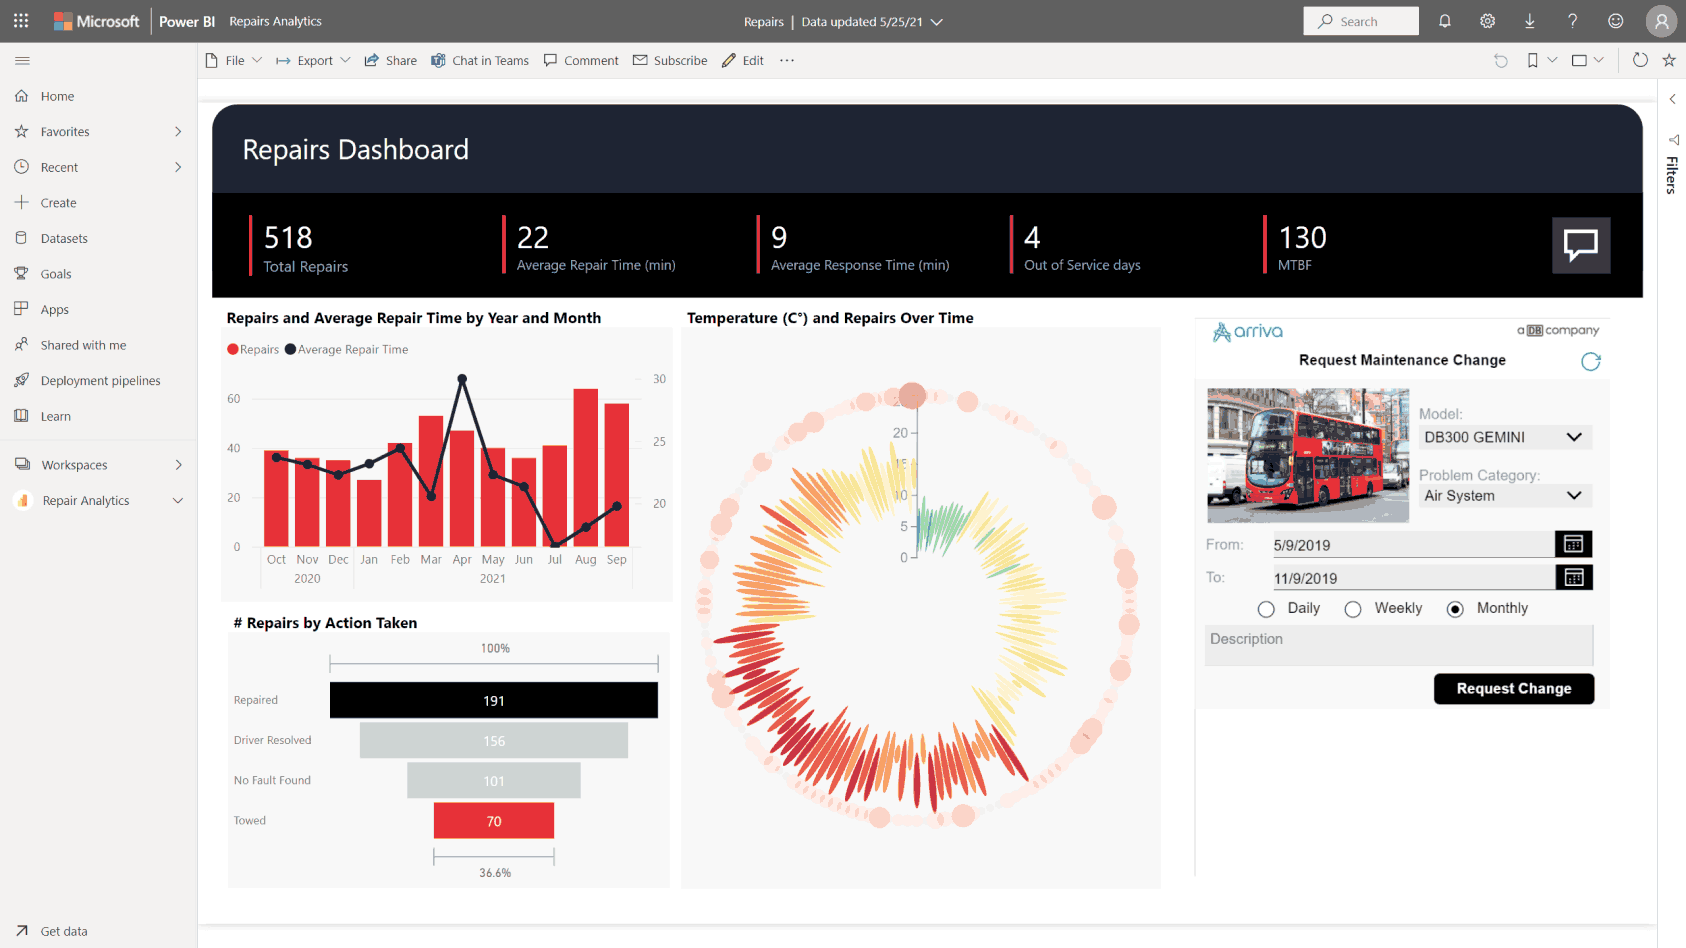
Democratize data insights with dashboards
A classic BI application most people will be familiar with is the dashboard, where data is obtained from multiple sources and presented visually in charts and graphs to give a sense of the company’s processes and strategies.
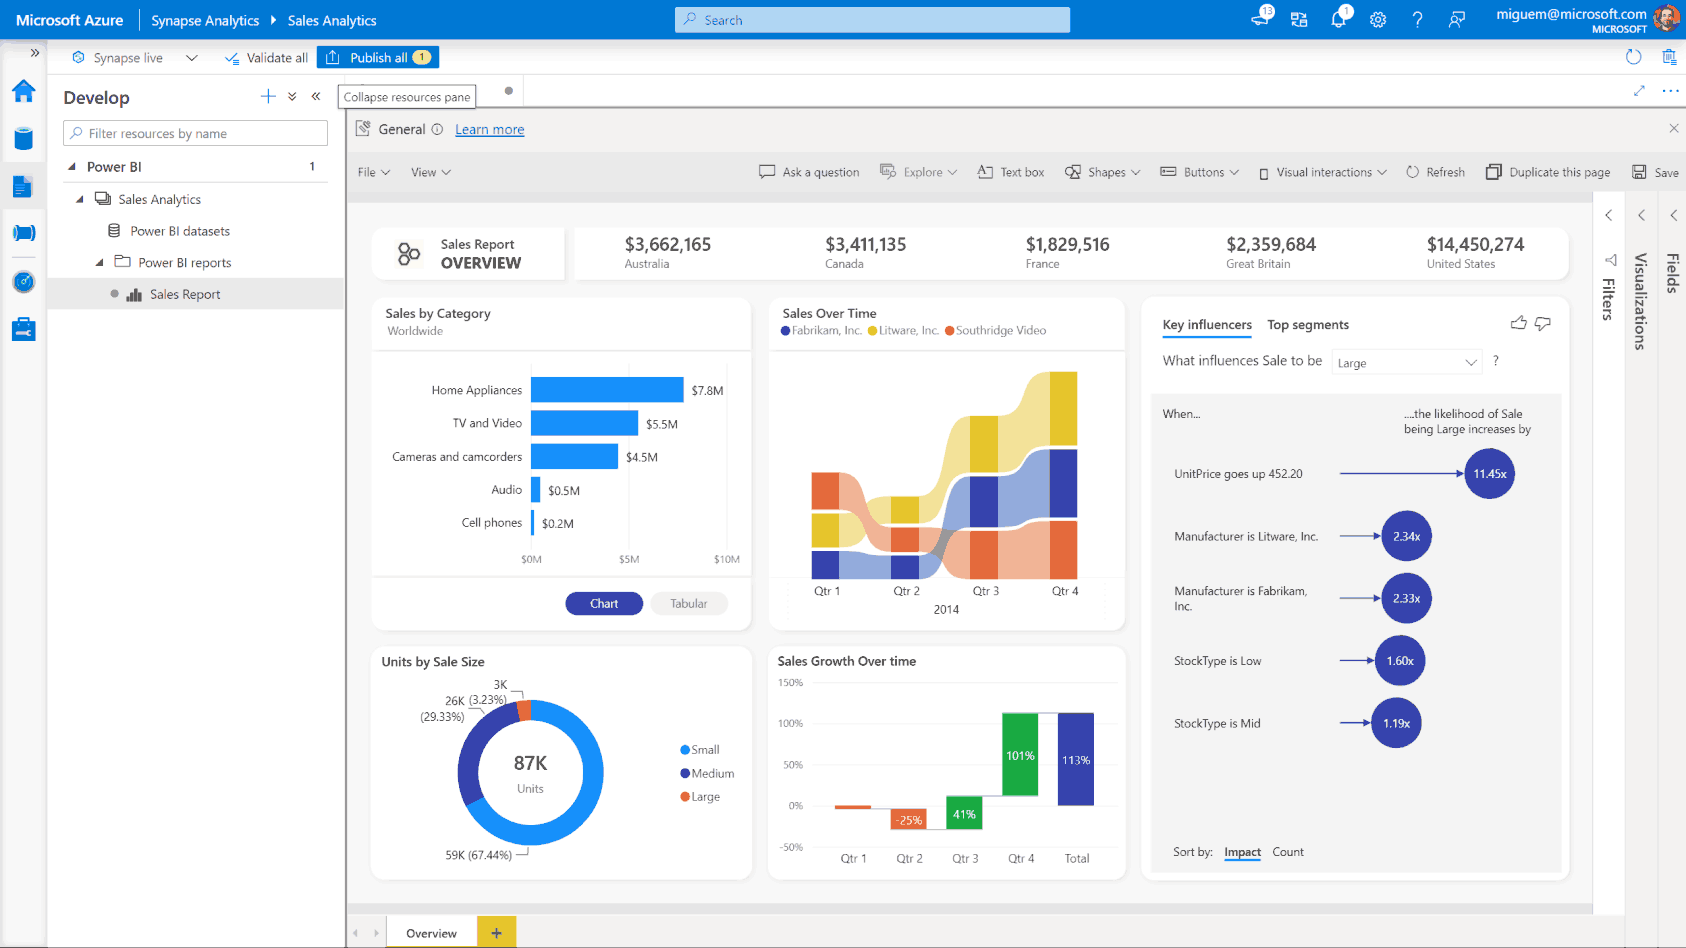
Tell data stories with advanced data visualization
Compelling data storytelling is more important than ever, given the burgeoning amounts of data generated in the digital age.
Database Integration
Power BI can connect with any data source to develop the data analytical KPIs like SQL, Oracle, SAP HANA, Excel Workbooks etc.
Drill Down / Interactive
All the KPIs and Dashboard are all alive or interactive, you can view the real-time data with interactive actions by clicking or drilling the dashboards KPIs to last or first step of data point.
Export Power BI File
You can easily export the dashboard in PDF or Power Point Format for presenting to executives and managing directors. Also you can export the Power BI file dataset in Microsoft Excel for preparing reports and data filtration task without any IT technical.
Power BI Desktop Limitation
Power BI Desktop version is only usable to local machine like PCs and Laptops. With only Power BI Desktop version you are not able to publish the dashboard globally on others website or any other locations.